Criteria for the Optimal Placement of Electric Vehicle Charging Infrastructure across Urban Transport Networks

Abror Abduvaliyev
Abstract
The rapid growth of electric vehicles (EVs) turns the location of charging stations from a technical detail into a core question of urban transport planning. A charger placed in the wrong district sits idle, while a shortage in the right one pushes drivers back to petrol. This article sets out the main criteria for placing charging infrastructure within a city’s transport network: demand, grid capacity, integration with public transport, the type of charging need, timing of use, equity, permitting and economics. The criteria are illustrated with real cases from Uzbekistan, the Netherlands and Shenzhen (China), and summarised in a practical framework that planners can adapt.
1. Introduction
Charging infrastructure is not a stand-alone asset. It sits on the same streets, in the same car parks and on the same electricity grid that the rest of the city depends on, so its placement should be planned together with the transport network rather than after it. The International Energy Agency notes that home charging remains the most popular way for EV owners to charge, but that more public chargers are needed for drivers who have no access to home charging. In dense cities, that group is large.
The question therefore is not only how many chargers a city needs, but where, of what power, and for whom. The sections below treat each criterion in turn.
2. Core placement criteria
2.1 Demand density and trip patterns
The first criterion is where charging demand actually arises: residential districts with many EV owners, commercial centres, workplaces, taxi and delivery hubs, and key points on intercity corridors. Registration data, ride-hailing trip data and parking surveys should be combined into a demand map. Fleet vehicles such as taxis and delivery vans drive very high utilisation and often justify fast chargers on their own.
2.2 Grid capacity and connection cost
A site with strong demand is of little use if the local transformer cannot supply it. Planners should screen candidate sites for spare capacity and connection cost before committing. Where several sites are comparable, those with existing capacity (bus depots, shopping centres, industrial parks) are cheaper and faster to deploy.
2.3 Integration with public transport
Chargers placed at metro terminals, bus stations and park-and-ride facilities serve two purposes. They capture long parking times, which suit slower and cheaper AC charging, and they encourage drivers to combine an EV trip with public transport instead of driving into the centre. Hubs that already have large parking areas and good electrical supply are natural candidates.
2.4 Type of charging need: home, destination and fast charging
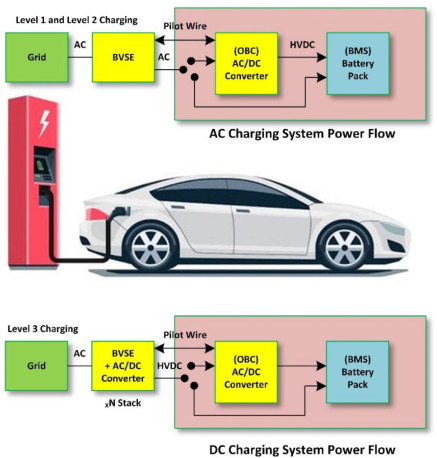
Different needs call for different hardware. Residents of apartment blocks without private parking depend on slow charging near their homes, typically overnight. Visitors and workers need destination charging of a few hours. Taxi drivers, couriers and intercity travellers need DC fast charging with short stops. A good plan assigns each location a clear role instead of installing the same unit everywhere.
2.5 Timing and utilisation
The number of plugs is only part of the picture; usable supply depends on when drivers charge. Analysis of a six-month hourly dataset from Shenzhen shows that a city can look well supplied on a charger map and still feel tight if many drivers need chargers in the same time window, which is why charging demand should be managed through pricing and scheduling as well as through new plugs.
2.6 Equity and geographic balance
Without deliberate planning, chargers cluster in wealthy or central areas. Setting minimum coverage targets for every district, and for residents without private parking in particular, prevents EV adoption from becoming limited to those who already have a garage.
2.7 Land, permitting and safety
Access to land and a short approval process often decide how quickly a network can grow. Fire safety clearances, pavement width, lighting and visibility should be checked for every site.
2.8 Economics
Operators need sufficient utilisation to recover capital costs. Early-stage networks may need public support, such as reduced customs duties or subsidised land, while mature networks can rely on market tariffs.
3. A summary framework
The table below combines the criteria into a checklist that can be turned into a weighted scoring model. The weights should be set locally, because a city with mostly private houses will weigh them differently from one dominated by apartment blocks.
| Criterion | What to measure | Typical indicator |
| Demand density | EV registrations, taxi/ride-hailing and delivery fleets, trip origins and destinations | EVs per km²; dwell-time-weighted parking demand |
| Grid capacity | Spare transformer and feeder capacity, cost and time of connection | kVA headroom; connection cost per kW |
| Transport integration | Proximity to metro/bus hubs, park-and-ride, taxi ranks, depots | Walking distance to a hub; hub passenger volume |
| Charging need type | Share of households without a private parking space | Households without off-street parking (%) |
| Utilisation and timing | Hourly charging profile, peak-hour queuing | Sessions per charger per day; peak-hour occupancy |
| Equity and coverage | Spread across districts, not only affluent areas | Chargers per 1,000 residents by district |
| Land and permitting | Land lease terms, approval time, safety clearances | Days to permit; availability of public land |
| Economics | CAPEX, tariff, expected load factor | Payback period; cost per kWh delivered |
4. Real-world cases
4.1 Uzbekistan: rapid growth and a strong capital–region gap
Uzbekistan’s EV market has expanded quickly. The National Statistics Committee reported 109,200 registered EVs as of 1 April 2026, and the Ministry of Energy has noted that the fleet passed 100,000 vehicles by the end of 2025. Charging infrastructure has grown as well: according to the Ministry of Economy and Finance, the number of charging stations rose 2.5 times in a year to 1,399 by May 2025, and Tashkent’s stations nearly tripled to 820, about 58.6% of the national total. Tashkent and its region together hold roughly 70% of all stations, while the same report shows the number of operating stations falling in Fergana and Syrdarya over six months. In August 2024, Karakalpakstan had only nine stations.
This pattern illustrates the equity and demand criteria: the capital naturally leads on demand, but a purely demand-led approach leaves regional cities and the corridors between them under-served. The government draft published in May 2026 aims for 4,000 stations by the end of 2026.
Policy measures also address the permitting and economic criteria. The procedure for installing and connecting stations was simplified in 2024, with permits for legal entities to take no more than a month, and a special night tariff for EV charging was announced. Plans allow chargers of up to 22 kW near multi-storey buildings and up to 7 kW at private homes, which matches the home-charging need described in section 2.4. State-owned land and premises can be leased for charging stations through the K-Savdo auction system for up to ten years, and charging equipment has been exempted from customs duties until 2027. On the supply side, the Tashkent-based company Pulseev plans 500 chargers by 2026 and 3,000 by 2030.
4.2 The Netherlands: planning for drivers without driveways
The Netherlands is a leading example of public charging at city scale. Public, semi-public and fast charging points reached almost 210,000 in 2025, up from about 181,000 in 2024 and about 63,000 in 2020, and Amsterdam and Rotterdam had about 16,000 and 11,000 respectively. The main driver is housing: roughly seven in ten Dutch households have no private driveway and rely on street parking or shared garages, so public charging is essential.
Data from March 2026 show the typical structure of a mature network: about 126,000 regularly accessible points, 79,025 with limited public access (for example in garages), and only 6,626 fast chargers, with more than 650,000 home charging points on top. Slow, widely distributed charging near homes forms the base, with fast charging in selected locations. A study by the land registry Kadaster, commissioned by ElaadNL, found about 2.5 million Dutch homes with space for their own charge point, which gives municipalities a reason to focus public investment where private options do not exist. The Dutch experience also shows that placement is a continuing task: 38 municipalities, including Hilversum, had fewer charging points in 2025 than a year before.
4.3 Shenzhen: fast charging on existing sites, with demand timing in mind
Shenzhen shows how a city can use its existing infrastructure. By 30 April 2024 the city had 362 supercharging stations, more than its petrol stations, and a later report described the new superchargers as largely built upon existing public charging facilities and distributed in large business complexes, bus stations and industrial parks. Shell’s Shenzhen Airport station, with 258 fast chargers, served more than 3,300 EVs a day during its trial run, which demonstrates the effect of a large concentrated demand source.
City rules also support the criteria above: newly built car parks must provide charging with at least 7 kW per charging pole, and new public car parks that include charging or battery swapping are exempt from separate construction approval. At the same time, the hourly Shenzhen data discussed in section 2.5 shows that more plugs alone do not remove the after-work rush, so placement should be combined with tariff and scheduling measures.
5. Recommendations for planners
- Start with data. Build a demand map from registrations, trip data and fleet activity before selecting sites.
- Check the grid. Screen candidate sites for grid headroom and connection cost early; prefer hubs and depots that already have supply.
- Match hardware to purpose. Use slow charging where cars park for hours, and fast charging where stops must be short.
- Plan for equity. Set minimum coverage for every district and for key corridors so that growth is not limited to the capital or the city centre.
- Review regularly. Monitor utilisation by hour and relocate or expand based on real use; the Dutch data show that networks need continuous adjustment.
6. Conclusion
Optimal charger placement balances several criteria at once: where demand is, where the grid can supply it, how well the site links with public transport, and who would otherwise be left without access. The cases of Uzbekistan, the Netherlands and Shenzhen show that the strongest results come from combining supportive regulation, use of existing sites and data-based monitoring. For fast-growing markets such as Uzbekistan, the next stage is to spread the network beyond the capital and along intercity routes while keeping charging reliable and affordable.
Similar Posts by The Mt Kenya Times:
- Exporting Teachers, Importing Standards: Is Namibia ready to strengthen classrooms in The Bahamas, and what does the request reveal about the regulation of teaching at home?
- From the Margins to the Centre: Governor Kadiva Hamutumwa, her first sixteen months in office, and an agenda for a lasting Ohangwena legacy
- Mt Kenya Times ePAPER November 7-8, 2026
- Karua demands Lissu’s release as Tanzania court conviction draws regional condemnation
- Jubilee accuses UDA of stealing its slogan as 2027 election battle lines sharpen
About the Author